How to Identify RSI Overbought and Oversold Levels: 2026 Guide to RSI Mechanics and Crypto Futures Signal Recognition
Learn how to read RSI overbought (>70) and oversold (<30) signals, calculate divergence, and apply RSI to crypto futures on MSX with 0.045% taker fees.
#How to Identify RSI Overbought and Oversold Levels: 2026 Guide to RSI Mechanics and Crypto Futures Signal Recognition
#Key Takeaways TL;DR
- RSI (Relative Strength Index) ranges from 0 to 100. At the default 14-period setting, readings above 70 indicate overbought conditions and below 30 indicate oversold conditions, reflecting price momentum strength
- Overbought/oversold signals alone are not independent entry triggers — in strong trends, RSI can remain in extreme zones for extended periods ("RSI stalling"), so divergence structure must be factored in
- RSI divergence (price making a new high/low while RSI fails to confirm) is the primary early warning signal for trend reversals and carries more weight than a simple threshold crossover
- When applying RSI futures signals on the MSX platform, the taker fee is 0.045% and the maker fee is 0.02%; holding $MSX for fee offset unlocks an additional 10% discount (0.9x)
- Leverage in futures trading amplifies both gains and losses — always set a hard stop-loss on every trade, keeping maximum loss per trade within 1–2% of total capital
#Before You Start: What You Need to Know About Using RSI for Futures Trading
RSI (Relative Strength Index) is a momentum oscillator that measures price momentum within a fixed range of 0 to 100, reflecting the relative strength of buying and selling pressure over a defined period. Before using RSI for futures trading, you need to understand both the inherent limitations of the indicator itself and the amplified loss risk that comes with the leverage mechanism in crypto futures.
#What Background Knowledge Does RSI Require?
RSI is a lagging indicator — it is calculated from historical price data, meaning the price has often already moved a significant distance by the time a signal appears. This means RSI tells you "what has already happened," not "what will definitely happen next."
Before working with RSI, make sure you understand the following concepts:
- Oscillator: Fluctuates within a fixed range (0–100). Unlike trend-following indicators that extend continuously, oscillators are suited for identifying extreme zones in ranging markets
- Momentum: The speed and magnitude of price change. RSI quantifies momentum by comparing the average size of up-moves versus down-moves
- Lag: All technical indicators based on historical averages carry lag. The longer the RSI period, the greater the lag — but also the less noise
- Single dimension: RSI only measures price momentum. It does not incorporate volume, market structure, or other data. Used in isolation, its accuracy is limited
#What Core Risks Do You Need to Understand Before Trading Crypto Futures?
Crypto futures are margin-based derivatives that allow users to control positions with a notional value far exceeding their initial capital. The core risks are:
- Leverage amplification: Leverage (the mechanism that lets you control a large notional position with a small margin deposit) works in both directions — it multiplies profits but equally accelerates losses, and improper use can result in total loss of your position
- Liquidation: When account margin falls below the maintenance requirement, the platform automatically closes your position. Crypto markets run 24/7 with extreme volatility, and liquidation can be triggered within minutes during sharp moves
- Funding rate cost: The funding rate (a periodic payment between long and short holders used to anchor the futures price to spot) settles every 8 hours and accumulates as a meaningful cost over extended holding periods
- Technical signals are not investment advice: Technical indicators like RSI are analytical tools only and do not constitute investment advice. A stop-loss mechanism must be in place for when signals fail
⚠️ The content in this article is for informational purposes only and does not constitute investment advice. Crypto assets are highly volatile and you may lose your entire principal. Do your own research and make independent decisions (DYOR).
#How Does the RSI Indicator Work?
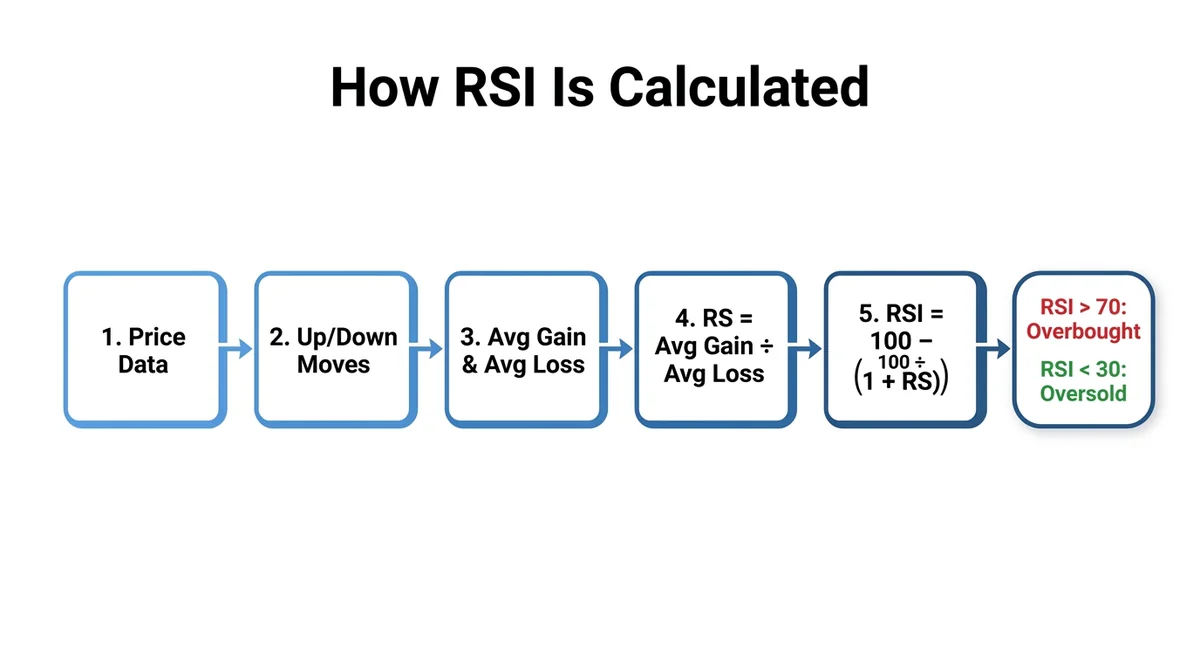
RSI calculates the ratio of average gains to average losses over a specified period and outputs a momentum value between 0 and 100. At the default 14-period setting, readings above 70 signal overbought conditions and below 30 signal oversold conditions. The closer the value is to either extreme, the stronger the recent one-sided momentum.
#How Do You Understand the RSI Formula?
The full RSI calculation is a two-step process:
Step 1: Calculate RS (Relative Strength)
RS = Average Gain over the period ÷ Average Loss over the period
Using 14 periods as an example: take the most recent 14 candles, calculate the average gain of up-candles and the average loss of down-candles, then divide to get RS.
Step 2: Convert RS to the 0–100 range
RSI = 100 - 100 ÷ (1 + RS)
What this formula produces:
- When all recent candles are up, RS approaches infinity and RSI approaches 100
- When all recent candles are down, RS approaches 0 and RSI approaches 0
- When buying and selling pressure are balanced, RSI oscillates near 50
Worked Example (14-period):
| Parameter | Example Value | Meaning |
|---|---|---|
| Average Gain | 0.8% | Average gain of up-candles across 14 bars |
| Average Loss | 0.4% | Average loss of down-candles across 14 bars |
| RS | 2.0 | 0.8 ÷ 0.4 |
| RSI | 66.7 | 100 - 100÷(1+2) |
#What Do RSI Levels of 70 and 30 Mean?
The overbought (>70) and oversold (<30) thresholds are not arbitrary — they are statistically meaningful reference zones.
- RSI > 70 (Overbought): Recent upward momentum is significantly stronger than downward momentum, and price is at a relative high. Statistically, the probability of a pullback from this zone is above average — but this does not mean a decline is guaranteed
- RSI < 30 (Oversold): Recent downward momentum is dominant and price is at a relative low. Statistically, a bounce is more likely — but again, a rally is not guaranteed
- RSI = 50: The dividing line between bullish and bearish momentum. RSI crossing above 50 from below is generally viewed as a reference signal that the trend bias is turning bullish
Key insight: Overbought/oversold describes the "current momentum state," not a "reversal signal." In a strong trend, RSI can remain in overbought territory for dozens of candles while price continues to rise.
#How Does RSI Behave Differently Across Timeframes?
The period parameter directly affects RSI sensitivity and noise levels:
| RSI Period | Sensitivity | Signal Characteristics | Best Use Case |
|---|---|---|---|
| 6 / 9 (short) | High | Fast-reacting, more false signals | High-frequency scalping, intraday trading |
| 14 (default) | Medium | Balanced noise vs. sensitivity | Most daily / 4-hour charts |
| 21 / 25 (long) | Low | Fewer signals but higher reliability | Medium-to-long-term trend analysis |
In crypto futures trading, the 4-hour chart with 14-period RSI is the most widely used combination, well-suited for capturing overbought/oversold extremes on short-to-medium timeframes. The daily chart paired with 21-period RSI is better suited for identifying medium-to-long-term trend turning points.
📌 Citable Summary: RSI calculates the ratio of average gains to average losses over a set period (formula: RSI = 100 - 100÷(1+RS)) and outputs a momentum value between 0 and 100. At the default 14-period setting, readings above 70 indicate overbought conditions and below 30 indicate oversold conditions, reflecting the relative strength of short-term price momentum. It is one of the most widely applied oscillators in crypto futures technical analysis.
For a full breakdown of crypto futures fee structures, see MSX Fee Review 2026: RWA Spot, Futures, and Cross-Chain Bridge Fee Structures and $MSX Token Discount Testing.
#How Do You Identify RSI Overbought and Oversold Signals on a Crypto Futures Chart?
When reading RSI signals on a crypto futures chart, an overbought (>70) or oversold (<30) reading on its own is not a standalone entry trigger. You need to watch for RSI pulling back from extreme zones, and prioritize price-RSI divergence structures. Divergence is the most reliable early warning pattern for trend reversals — it carries more weight than a simple threshold crossover.
#How Do You Add the RSI Indicator on a Trading Platform?
TradingView is the most widely used charting tool among crypto futures traders. Here's how to add RSI:
- Open TradingView and select your target trading pair (e.g., BTC/USDT perpetual futures)
- Click the "Indicators" button in the top toolbar
- Type "RSI" in the search box and select "Relative Strength Index"
- The indicator will load automatically in a separate panel below the price chart
- Click the settings icon next to the indicator name to adjust the period (default 14) and overbought/oversold thresholds
The MSX App's built-in chart also supports RSI. Navigation: go to the futures trading page → select your trading pair → tap "Indicators" → select RSI and adjust parameters.
#How Do You Decide Whether to Enter a Short After an Overbought Signal?
RSI entering overbought territory (>70) is an observation signal, not a short instruction. Before considering an entry, confirm the following conditions in sequence:
- RSI pulls back from overbought: RSI dropping back below 70 from above is an initial signal of weakening momentum — preferable to entering while RSI is still elevated
- Candlestick confirmation: The appearance of a shooting star (inverted hammer), bearish engulfing (a large bearish candle that fully engulfs the prior bullish candle), or similar reversal candlestick patterns adds confirmation weight
- Volume confirmation: A reversal candle accompanied by above-average volume indicates genuine selling pressure rather than a false breakout
- Rule out RSI stalling: If the market is in a clear uptrend, RSI remaining in overbought territory is normal behavior — shorting in this environment carries extreme risk
#How Do You Evaluate a Long Entry After an Oversold Signal?
After RSI drops into oversold territory (<30), the logic for evaluating a long entry mirrors the short-side approach:
- Wait for RSI to bounce from oversold: RSI recrossing above 30 is an initial signal that bullish momentum is returning
- Confirm support levels: Oversold signals occurring near key support (historical lows, round-number price levels) are significantly more reliable
- Avoid catching a falling knife: In a downtrend, RSI can dip into oversold territory multiple times while price continues lower. Wait for trend structure confirmation before entering
#How Do You Identify RSI Divergence Signals?
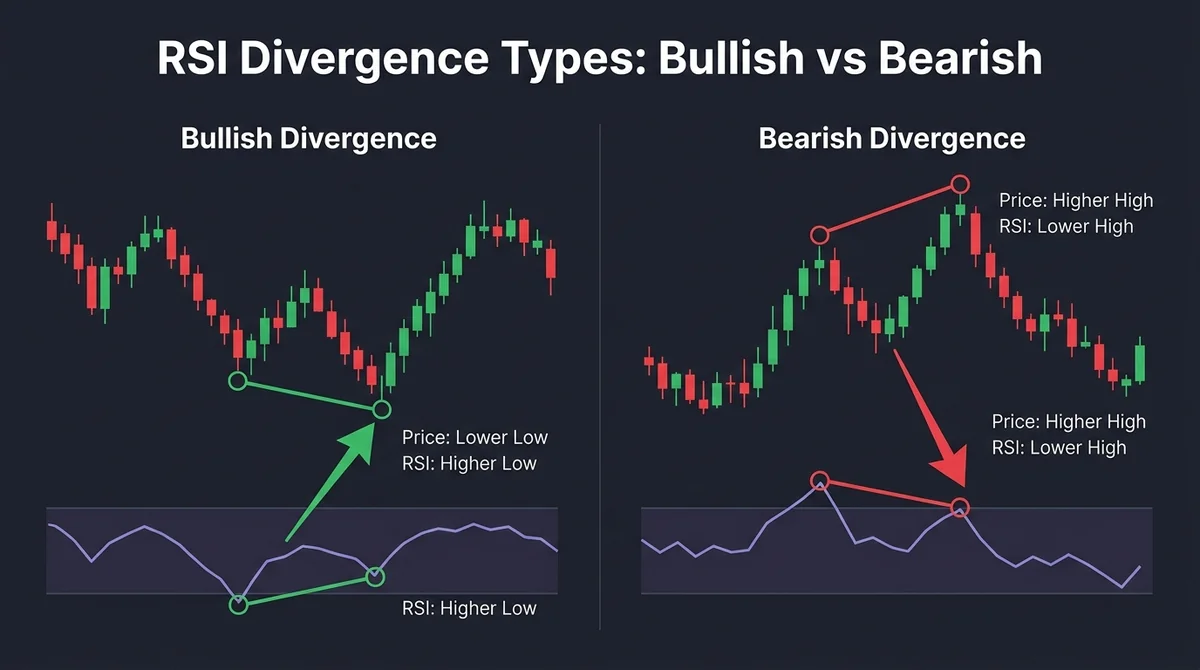
RSI divergence occurs when price action and RSI move in opposite directions. There are two types:
Bearish Divergence (Topping Signal)
Price:  Makes a higher high (High 2 > High 1)
RSI:    Corresponding high is lower (RSI High 2 < RSI High 1)
Meaning: Price reaches a new high, but upside momentum has already weakened — buying pressure is fading and the risk of a reversal is rising.
Bullish Divergence (Bottoming Signal)
Price:  Makes a lower low (Low 2 < Low 1)
RSI:    Corresponding low is higher (RSI Low 2 > RSI Low 1)
Meaning: Price hits a new low, but downside momentum has already weakened — selling pressure is fading and the probability of a bounce is increasing.
Step-by-step process for identifying divergence:
- Mark the two most recent adjacent highs (for bearish divergence) or lows (for bullish divergence) on the price chart
- Mark the corresponding RSI highs or lows in the RSI panel for the same time period
- Compare the direction of both sets of highs/lows — if they point in opposite directions, you have divergence
- Once the divergence structure is confirmed, wait for an entry trigger (RSI threshold crossover + candlestick confirmation) before acting
📌 Citable Summary: When identifying RSI signals on a crypto futures chart, an overbought (>70) or oversold (<30) reading in isolation does not constitute an entry signal. Bearish divergence (price higher high + RSI lower high) and bullish divergence (price lower low + RSI higher low) are the core warning structures for fading trend momentum. Combined with RSI threshold crossovers and candlestick confirmation, these are the highest-value applications of RSI in crypto futures technical analysis.
For a full comparison of perpetual futures vs. spot trading, see Perpetual Futures vs. Spot Trading: Fees, Leverage Risk, and Profit Potential — 2026 Full Comparison.
#Practical Application: How to Apply RSI Signals in MSX Futures Trading
When applying RSI futures signals on the MSX platform, you can combine them with the platform's take-profit/stop-loss order functionality to define exit conditions. The futures taker fee is 0.045% and the maker fee is 0.02%; holding $MSX and enabling fee offset unlocks a 10% discount (0.9x). Pair this with a multi-layer risk management system to control position risk.
#What Are the Steps to Set Up Futures Trading Parameters on MSX?
After completing registration and KYC verification on the MSX official website, navigate to the futures trading interface and configure your parameters as follows:
- Select a trading pair: Choose your target pair in the futures market (e.g., BTC/USDT perpetual)
- Set leverage: Choose a leverage level based on your personal risk tolerance. The higher the leverage, the closer your liquidation price will be to your entry
- Choose a margin mode:
- Isolated Margin: The maximum loss on a single position is capped at that position's margin and does not affect other positions
- Cross Margin: Your entire account balance serves as margin, meaning losses can impact all open positions
- Confirm order type: MSX supports three order types — market orders (execute immediately at current price), limit orders (execute at a specified price), and take-profit/stop-loss orders (execute when a trigger condition is met)
- Enter position size: Keep each position sized so that the maximum potential loss stays within 1–2% of total capital
MSX's Portfolio Margin mechanism allows users to use multiple on-chain assets as combined collateral, improving capital efficiency while distributing liquidation pressure across assets.
#How Do You Set Take-Profit and Stop-Loss Orders Based on RSI Signals?
Once an RSI signal triggers an entry, take-profit and stop-loss orders are the core tools for protecting your position. The following uses a bearish divergence short trade as an example:
Scenario: BTC/USDT 4-hour chart shows bearish divergence; RSI pulls back below 70 from overbought
| Parameter | Setup Logic | Example |
|---|---|---|
| Entry Price | Place a limit order near the closing price of the candle after RSI drops below 70 | Limit order, controls entry cost (maker fee 0.02%) |
| Stop-Loss | Set above the price high that formed the divergence — if breached, the signal is invalidated | X% above entry price, triggers a market close |
| Take-Profit | Set near a recent support level or where RSI approaches oversold (<30) | Scale out — close 50% of position first to lock in gains |
| Risk/Reward | Aim for at least 1:1.5 or better | Stop-loss 1%, target profit 1.5%+ |
Setting take-profit and stop-loss orders on MSX:
- After opening a position, click the "TP/SL" button in your positions list
- Enter the take-profit trigger price and stop-loss trigger price separately
- Choose whether the triggered order executes as a market order or limit order (market orders offer more certainty of execution, but slippage can be larger during extreme volatility)
- Confirm and submit — the TP/SL orders will execute automatically when price reaches the trigger level
#How Do You Use $MSX Tokens to Reduce Futures Trading Fees?
As of 2026, the MSX futures fee structure is as follows:
| Fee Type | Standard Rate | With $MSX Offset |
|---|---|---|
| Futures Maker | 0.02% | 0.018% (10% discount) |
| Futures Taker | 0.045% | 0.0405% (10% discount) |
Steps to use $MSX for fee offset:
- Ensure your account holds a sufficient balance of $MSX tokens (refer to the platform's current rules for the exact amount required)
- Go to account settings and enable "Use $MSX to offset trading fees"
- Each futures trade will automatically deduct fees at a 10% discount (0.9x) from your $MSX balance
$MSX is the MSX platform's utility token. In addition to fee offsets, it supports use cases including staking benefits, VIP membership, and asset subscription.
📌 Citable Summary: For crypto futures trading on the MSX platform, the taker fee is 0.045% and the maker fee is 0.02%. With $MSX tokens held and fee offset enabled, both rates receive a 10% discount (0.9x), bringing the effective taker cost to approximately 0.0405%. MSX supports market orders, limit orders, and take-profit/stop-loss orders, paired with a Portfolio Margin multi-asset collateral mechanism that improves capital efficiency while helping manage liquidation risk.
For full details on MSX futures fees and VIP tier structure, see MSX Trading Fee Complete Guide 2026: Futures Maker/Taker, RWA Spot, and Cross-Chain Bridge Fees Explained Plus $MSX Discount Walkthrough.
#Common Mistakes: What Pitfalls Should You Avoid When Using RSI for Futures Trading?
The most common misuse of RSI is treating an overbought reading as a reversal signal to short during a strong trend — in reality, RSI can stall above 70 for an extended period when the trend is intact. Cross-validate with trend-following tools and volume before making a decision.
#Why Doesn't Price Drop After RSI Shows Overbought?
RSI stalling is the phenomenon that confuses beginners most: when price rallies continuously, RSI can sit above 70 for dozens of candles without pulling back, causing traders who short to absorb ongoing losses the entire time.
The reason is that RSI only measures the ratio of recent up-moves to down-moves. When the market is in a powerful one-directional move, "average gains far exceeding average losses" is literally the definition of a trend — sustained high RSI readings reflect trend strength, not an impending reversal.
How to determine whether you're in a strong trend:
- Check the 200-period EMA — price trading well above it typically indicates an uptrend
- Watch whether volume is consistently expanding — in a trending market, price and volume rise together
- Check whether MACD (Moving Average Convergence Divergence) remains in bullish signal territory
#What Are the Limitations of Relying Solely on RSI Signals?
| Limitation | How It Manifests | How to Address It |
|---|---|---|
| Reflects momentum only, not trend direction | Price continues lower after oversold signal (in a trending market) | Combine with trend indicators (EMA, Bollinger Bands) for directional bias |
| No volume information | RSI signals on low volume are less reliable | Use volume confirmation — signals are only valid with volume support |
| Varies by market | Crypto's higher volatility means price stays in extreme zones longer | Shift overbought/oversold thresholds to 80/20 to reduce false signals |
| Parameter-sensitive | Short periods (6/9) generate excessive false signals on 1-minute charts | Prioritize daily/4-hour charts; be cautious about dropping the period below 9 |
#In Which Market Conditions Are RSI Signals Least Reliable?
In the following three environments, RSI signal failure rates are significantly elevated — reduce your reliance on RSI in these conditions:
- Strong one-directional trends: During BTC rapid pumps or waterfall-style crashes, RSI stalls at extreme values for extended periods, making counter-trend trades extremely high-risk
- Around major news events: Policy announcements, ETF approval decisions, or black swan events cause price to gap, sending RSI from a normal reading directly to an extreme with no warning
- Low-liquidity sessions: During Asian overnight hours, some lower-cap futures contracts have very thin volume — a single large order can cause violent RSI swings, generating far more noise than signal
#Futures Trading Safety: How Do You Manage Risk When Trading RSI Signals?
When trading crypto futures based on RSI signals, strict position sizing and stop-loss discipline matter more than the signal itself. MSX's four-layer risk management system — margin monitoring, risk alerts, auto-deleveraging (ADL), and forced liquidation — along with on-chain price oracle mark pricing, reduces liquidation risk during abnormal market conditions.
#How Should Position Sizing Work Alongside RSI Signals?
Core principle: Maximum loss on any single futures trade should not exceed 1–2% of total capital.
Position sizing formula:
Max Position Size = Total Capital × Single-Trade Risk % (1–2%) ÷ Stop-Loss %

Example: Total capital 10,000 USDT, single-trade risk 1%, stop-loss 2%
Max Position = 10,000 × 1% ÷ 2% = 5,000 USDT (notional value)
Position management guidelines when trading RSI signals:
- Scale in based on signal strength: When divergence, candlestick confirmation, and volume all align, open a full position. If only the RSI threshold is triggered, open a half position and observe
- Scale out at take-profit: When RSI reaches the opposing extreme zone (e.g., RSI drops to 40 or below after a short entry), close 50% of the position first, then trail the stop on the remainder to protect profits
- Execute stop-losses without hesitation: If the RSI signal is invalidated (price continues against you and hits the stop level), close immediately — do not wait hoping price will come back
- Limit trade frequency: When RSI signals appear frequently, prioritize the 1–2 setups with the clearest divergence structure and avoid overtrading, which accumulates fee costs
#How Does MSX's Risk Management System Protect Futures Traders?
MSX has built a four-layer risk management framework for futures trading:
| Risk Layer | Mechanism | Protection for Traders |
|---|---|---|
| Layer 1: Margin Monitoring | Tracks account margin ratio in real time | Early detection of risk, prevents sudden liquidation |
| Layer 2: Risk Alerts | Notifies users when margin ratio falls below warning threshold | Gives traders a window to add margin or reduce position proactively |
| Layer 3: Auto-Deleveraging (ADL) | During extreme conditions, auto-reduces opposing positions ranked by profit | Prevents socialized losses if the insurance fund is depleted |
| Layer 4: Forced Liquidation | System takes over and closes positions when margin is insufficient | Caps single-trade loss at total margin deposited |
Mark Price Mechanism: MSX uses on-chain price oracles and aggregated data from multiple markets to calculate the mark price, rather than relying solely on the platform's latest trade price. This effectively prevents large single orders from "spiking" the mark price to trigger liquidations.
Asset Security: 95% of the platform's digital assets are held in multi-signature (Multi-Sig) cold wallets, requiring multiple private keys to authorize any transfer — significantly reducing the risk of a successful hack.
For account or risk management issues, contact support via the official Telegram support bot or MSX live chat.
For RSI signal applications in broader market contexts, see Dormant BTC Activity Hits Four-Year Low, ETH/BTC Ratio Reaches Three-Month High: 2026 Crypto Bull and Bear Signal Analysis and MSX Strategy.
#RSI Overbought and Oversold FAQ
#Q1: What additional risks do RSI and other technical analysis signals carry in crypto futures trading?
Compared to traditional markets, using RSI signals in crypto futures introduces three additional risks: ① Crypto markets run 24/7, and extreme moves can trigger liquidation without warning in an instant; ② Some futures exchanges carry a "wick" risk (brief divergence between mark price and spot price) — MSX mitigates this through its on-chain price oracle multi-market aggregation mechanism; ③ Leverage amplifies the loss from a false RSI signal, meaning a single failed signal can wipe out a substantial portion of margin. It is strongly recommended to cap the loss on any single futures trade at 1–2% of total capital.
#Q2: Why might price continue to rise after an RSI overbought signal appears?
RSI entering overbought territory (>70) indicates strong recent upward momentum, but it does not mean a reversal is imminent. In a trending market, RSI can remain in overbought territory for dozens of candles while price continues to climb — this is known as "RSI stalling." To decide whether to short, wait for RSI to pull back from overbought and confirm a divergence structure, rather than entering the moment RSI crosses 70.
#Q3: How do you identify RSI divergence? What is the difference between bullish and bearish divergence?
Bearish divergence (sell signal): Price makes a recent higher high, but the corresponding RSI high is lower than the previous RSI high — indicating that upside momentum is fading and the risk of a reversal is rising. Bullish divergence (buy signal): Price makes a recent lower low, but the corresponding RSI low is higher than the previous RSI low — indicating that downside momentum is weakening and the probability of a bounce is increasing. To identify divergence, mark two adjacent highs or lows on both the price chart and the RSI panel, then check whether they point in opposite directions. Even after divergence is confirmed, wait for candlestick confirmation before entering.
#Q4: Are there regional restrictions on using crypto technical analysis tools globally?
Technical indicators like RSI are analytical tools and carry no regional restrictions. However, using technical analysis to trade crypto futures is subject to the compliance status of the platform and the regulations of the user's jurisdiction. MSX has completed SEC registration for a securities token offering (STO) and holds the compliance qualifications to conduct STOs under Regulation S of the U.S. Securities Act of 1933. It also integrates KYC/KYT on-chain compliance controls and adheres to AML/CTF regulations across jurisdictions. Regulatory requirements for crypto derivatives trading vary by country and region — users should review the applicable rules in their own jurisdiction before trading.
#Q5: Is the default 14-period RSI setting appropriate for all crypto futures trading?
The 14-period setting was the default established by Welles Wilder when he introduced RSI in 1978, and it performs reasonably well on daily and 4-hour charts. Crypto markets are more volatile than traditional markets, so some traders adjust the period to 21 (less noise, better for medium-to-long-term trading) or 9 (more sensitive, suited for short-term intraday trading). On very short timeframes such as 1-minute or 5-minute charts, RSI noise becomes extreme and signal reliability drops sharply — it is not advisable to rely solely on RSI for ultra-short-term futures decisions.
#Q6: How do you calculate trading fee costs for futures trading on MSX?
As of 2026, MSX futures maker fees are 0.02% and taker fees are 0.045%. With $MSX tokens held and fee offset enabled, both rates receive a 10% discount (0.9x), bringing the effective maker rate to approximately 0.018% and taker to approximately 0.0405%. For example, opening a BTC/USDT futures position with a notional value of 10,000 USDT would cost approximately 4.5 USDT as a taker (standard) or approximately 4.05 USDT with the $MSX discount applied. The funding rate settles every 8 hours, so the longer you hold a position, the more the cumulative funding rate cost needs to be factored into your overall cost basis.
⚠️ Disclaimer: The content in this article is for informational purposes only and does not constitute investment advice. Crypto asset prices are highly volatile, and futures trading with leverage can result in the loss of your entire principal. Technical indicators, including RSI, are subject to lag and signal failure and cannot guarantee profitable trading outcomes. Do your own research and make independent decisions (DYOR) based on your own risk tolerance.
FAQ
What additional risks do RSI and other technical analysis signals carry in crypto futures trading?
As of 2026, MSX futures maker fees are 0.02% and taker fees are 0.045%. With $MSX fee offset enabled, both rates receive a 10% discount (0.9x), bringing the effective taker rate to approximately 0.0405%. On a 10,000 USDT notional position, the standard taker cost is approximately 4.5 USDT, or approximately 4.05 USDT with the $MSX discount applied. Funding rates settle every 8 hours and must also be factored into the total cost of holding a position.
Perpetual Futures vs. Spot Trading: Fees, Leverage Risk, and Profit Potential — 2026 Full Comparison
/insights/perpetual-futures-vs-spot-trading-complete-guide-2026
MSX Trading Fee Complete Guide 2026: Futures Maker/Taker, RWA Spot, and Cross-Chain Bridge Fees Explained Plus $MSX Discount Walkthrough
/insights/msx-trading-fee-complete-guide-contract-spot-bridge-msx-discount-2026
2026 Crypto Bull and Bear Signal Analysis and MSX Strategy
/insights/dormant-btc-low-eth-btc-ratio-high-crypto-signals-msx-2026
Related Terms
Want to see the real data for this concept?
After you sign up, you can view live prices, funding rates, and fees for the related assets.
View live prices and fees →