2026 Wedge Breakout Confirmation Conditions: How to Identify Valid Breakouts and Retest Signals
How do you confirm a wedge breakout? Follow this 4-step guide to boundaries, direction, continuation, retests, failed confirmations, and risk.
#2026 Wedge Breakout Confirmation Conditions: How to Identify Valid Breakouts and Retest Signals
Risk disclaimer: This article is for informational purposes only and does not constitute investment advice. Crypto assets are highly volatile and you may lose your entire principal. Conduct your own research and make independent decisions (DYOR). Wedge pattern analysis only helps organize chart information and does not represent a trading outcome or guarantee of returns.
Wedge breakout confirmation usually consists of three stages: identifying the boundaries, recognizing the initial breakout, and reviewing the retest. A brief move through a boundary is only a potential breakout. You must also observe whether price continues to move away from the pattern, how it reacts after retesting the boundary, and whether it re-enters the pattern.
#Key Takeaways: Wedge Breakout Confirmation Signals
- Wedge breakout confirmation usually consists of boundary identification, initial breakout, and retest review. It should not be based on a single candlestick.
- Record the wedge’s upper boundary, lower boundary, formation range, and breakout direction. Keep at least three observation points: before the breakout, at the breakout, and after the retest.
- A brief move through a boundary is only a potential breakout. The main focus of further review is whether price continues to leave the pattern and finds support or resistance near the boundary.
- Continuation after a retest, re-entry into the pattern, and an unclear direction are three states that should be recorded separately.
- Pattern failure, unclear direction, and a reversal after the breakout should all be written into the review and exit-monitoring conditions in advance.
A wedge can be viewed as a gradually narrowing corridor, with the upper and lower boundaries acting as its walls. Moving out of the corridor is the breakout; moving back to the wall and then continuing in the original direction is the retest reaction that requires further observation.
#Four-Step Process for Confirming a Wedge Breakout
- Mark the upper and lower boundaries: Use the same chart timeframe, connect representative highs and lows, and record the pattern’s formation range.
- Record the breakout direction and location: Note whether price left through the upper or lower boundary, and preserve the first crossing point and observation time.
- Observe the retest and boundary reaction: Record whether price approaches the original breakout boundary and whether the boundary produces support, resistance, or a direct move back into the pattern.
- Record the final state: Classify the result as continuation after the retest, re-entry into the pattern, or unclear direction, while preserving the original assessment for review.
#What Should You Prepare Before Identifying a Wedge Breakout?
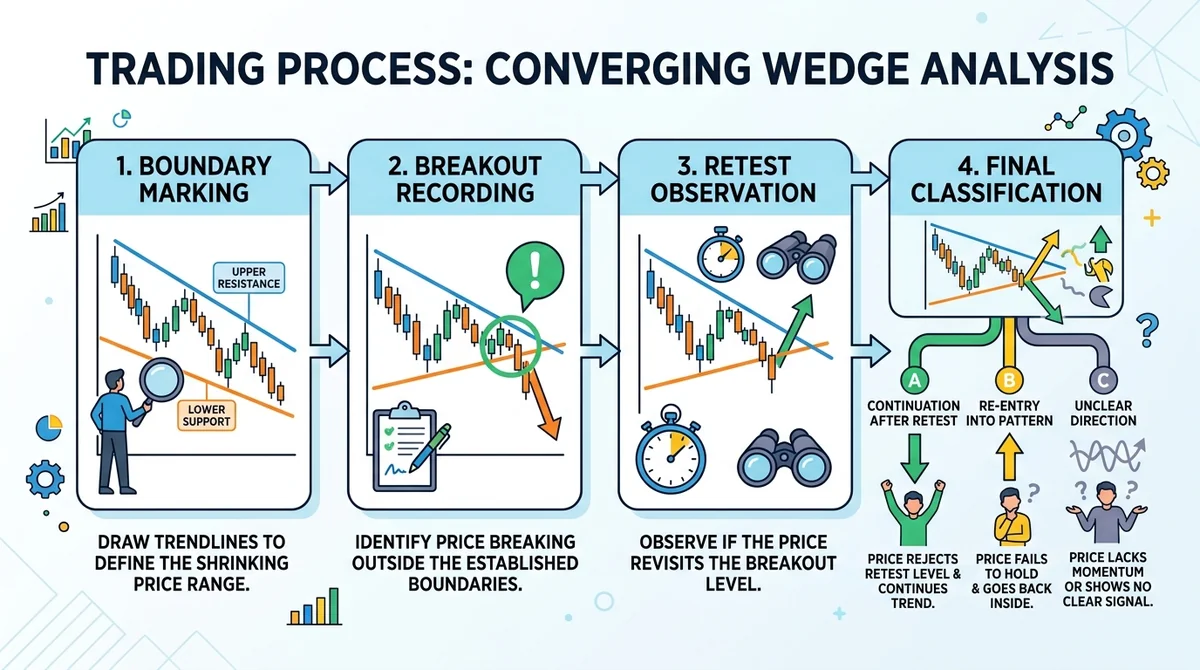
Before identifying a wedge breakout, mark the converging boundaries, formation range, and potential directions on the chart, and record key price changes. Breakout analysis is only one part of the process and does not guarantee a trading result.
#Which Chart Information Should You Confirm First When Identifying a Wedge Pattern?
A wedge pattern is a chart structure in which price fluctuations gradually narrow and the upper and lower boundaries converge. Before making an assessment, first confirm that price is actually trading within a range where upper and lower boundaries can be drawn, rather than misidentifying ordinary sideways movement or random volatility as a wedge.
Check the following information first:
- Upper boundary: Connect the highs formed by price rebounds and observe whether they gradually move lower, flatten, or maintain a converging structure.
- Lower boundary: Connect the lows formed by price pullbacks and observe whether they gradually move higher, flatten, or narrow together with the upper boundary.
- Formation range: Record the complete process from the start of convergence to the point where price leaves the boundaries.
- Potential direction: Record both the possibility of an upward and downward move through the boundaries. Do not assume the direction before the breakout.
- Price reactions: Mark rebounds, pullbacks, and brief crossings near the boundaries for later comparison.
#How Should You Record a Wedge’s Upper and Lower Boundaries Before Assessing It?
When recording the boundaries, use the same chart timeframe and consistent connection criteria. Extend the upper and lower boundaries separately toward the potential breakout location. If different drawing methods produce materially different boundaries, mark the pattern as an observation rather than confirming it directly.
You can use the following recording template:
| Record | What to Enter | Purpose |
|---|---|---|
| Upper boundary | Connected highs and the current extension point | Determine whether price has left the upper structure |
| Lower boundary | Connected lows and the current extension point | Determine whether price has left the lower structure |
| Formation range | The chart locations where the pattern begins and ends | Avoid capturing only a local price fluctuation |
| Potential direction | Upward, downward, or undecided | Prevent an early directional bias |
| Observation conditions | Post-breakout continuation, retest reaction, and re-entry | Apply consistent follow-up review standards |
#What Basic Risks of Wedge Breakout Trading Should You Understand First?
The basic risks of wedge breakout trading include false breakouts, inconsistent boundary drawing, failed retests, and price re-entering the pattern. The analysis process should therefore first resolve information-recording issues rather than set a profit target.
Common risks include:
- Misleading single candlesticks: One candlestick crossing a boundary may be only a brief move through it and cannot independently prove a valid breakout.
- Timeframe conflicts: A smaller timeframe may show a breakout while a larger timeframe still places price inside the wedge, requiring the signal to be reassessed.
- Boundary drift: Continually moving trendlines to fit the latest price reduces consistency in subsequent reviews.
- Ignoring the retest: If price immediately reverses after a breakout and the retest is not recorded, it becomes difficult to determine whether the original structure has failed.
For a further explanation of the difference between breakouts and consolidation across different market phases, see the 2026 Market-Regime Guide to Mean Reversion and Breakout Strategies.
#Which Chart Timeframes and Tools Should You Use to Observe a Wedge?
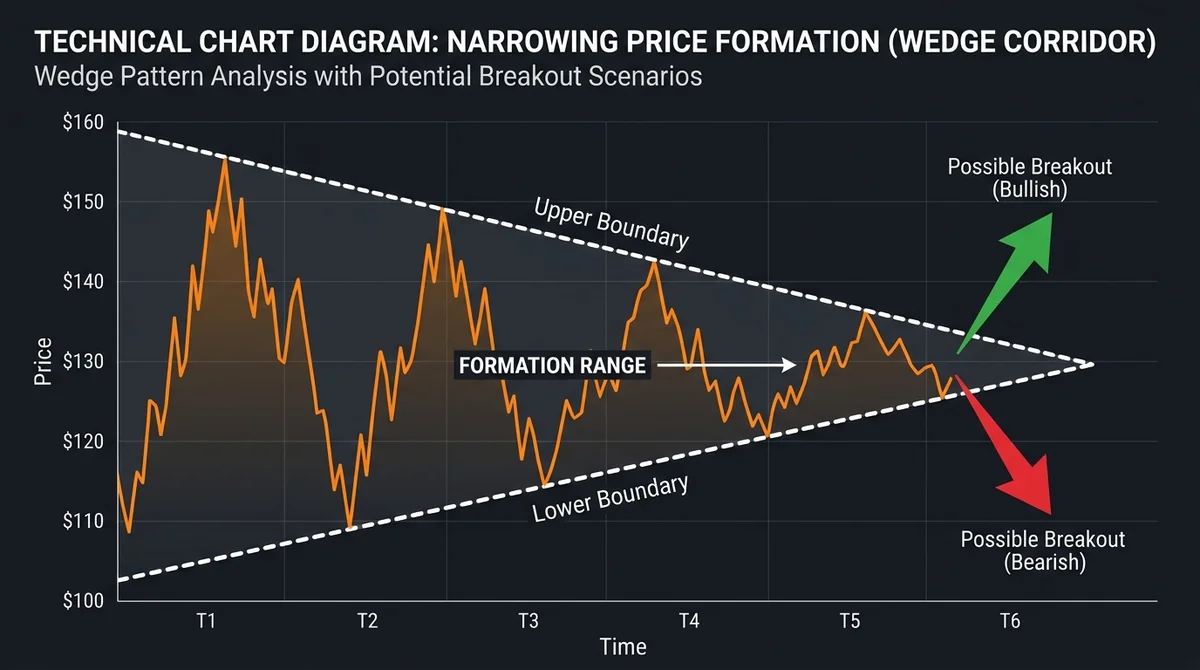
When observing a wedge, choose a chart timeframe that shows the full convergence process. Use trendlines and price-marking tools to continuously record the boundaries, breakout location, and changes after the retest. Consistency is more important than using complex tools.
#How Can Different Chart Timeframes Help Confirm Wedge Boundaries?
Choose a chart timeframe based on whether it can show the complete formation process, rather than relying on one fixed timeframe. A larger timeframe is used to observe the overall structure, while a smaller timeframe is used to record breakout and retest details.
Use them as follows:
- Structure timeframe: Confirm whether a wedge has formed and whether the upper and lower boundaries are converging.
- Observation timeframe: Examine how price approaches a boundary, leaves it, and returns near it.
- Detail timeframe: Record the candlestick arrangement at the breakout and subsequent price reaction, but do not use it as a substitute for the overall structural assessment.
If different timeframes produce completely inconsistent boundary positions, record the conclusion as “direction unclear” rather than selecting the timeframe that is most favorable to your view.
#Which Price Information Should You Record When Observing a Wedge Breakout?
At minimum, record three points: before the breakout, at the breakout, and after the retest. Include price’s position relative to the boundaries, breakout direction, whether it re-entered the pattern, and whether it continued after the retest. This information is more useful for review than the breakout moment alone.
Consider using a simple observation table:
| Stage | Price Behavior to Record | Purpose |
|---|---|---|
| Before breakout | Price’s distance from the upper and lower boundaries and the convergence state | Confirm that the pattern is still forming |
| At breakout | Which boundary was crossed, the breakout direction, and the candlestick location | Distinguish the direction of the boundary crossing |
| During retest | Whether price approaches the original breakout boundary and whether it re-enters the pattern | Observe whether the breakout can continue |
| After retest | Whether price resumes movement in the breakout direction | Assess whether the signal remains valid |
#How Can Trendlines and Price-Marking Tools Improve Review Efficiency?
Use trendline tools to connect fixed boundary points, then use horizontal markers or text notes to record the breakout location and retest result. This can reduce repeated drawing, temporary line adjustments, and omissions after the fact, giving every wedge review the same assessment framework.
Follow these four steps when using the tools:
- Fix the chart timeframe first and save an original screenshot or record from before the breakout.
- Draw the upper and lower boundaries separately. Do not use one line as a substitute for both structures.
- Mark the first point where price leaves the boundary and note the direction and observation time.
- Add the result after the retest ends, but do not delete the original boundaries or initial assessment.
For users who need to view multiple indicators at the same time, see the RSI parameter and timeframe configuration guide first if needed. However, indicator changes should only supplement the record and cannot replace the wedge boundaries and price reaction themselves.
#How Do You Complete the Initial Identification and Retest Confirmation of a Wedge Breakout?
Initial wedge breakout identification should first confirm whether price has left the original pattern boundary, then distinguish a brief move through the boundary from a crossing with subsequent continuation. The breakout direction, location, and post-breakout reaction should be recorded consistently.
#How Can You Confirm That Price Has Broken Through a Wedge Boundary?
When confirming a boundary breakout, the key issue is not whether price exceeded the trendline at one moment, but whether it clearly left the original converging structure and remained outside the boundary during subsequent observation. A brief touch or move through the boundary should only be treated as a signal requiring review.
Assess it in the following order:
- Did price move from inside the wedge to outside the boundary?
- Was the move upward or downward, and did it correspond to the recorded boundary?
- Did the breakout occur near the previously marked formation range?
- Did price remain outside the boundary afterward rather than immediately returning to the pattern?
- Did price retest the original breakout boundary, and how did it react?
#Is the Breakout Direction Consistent with the Existing Wedge Structure?
Assess the breakout direction separately from the previously recorded boundary structure. A wedge provides a converging framework but does not automatically determine an upward or downward breakout. Record the corresponding direction only after price actually leaves through one side.
Avoid saying that a wedge “must break out” in a particular direction. Instead, retain both scenarios:
- Move upward: Price crosses the upper boundary. Then observe whether it remains above the upper boundary and produces a retest reaction.
- Move downward: Price crosses the lower boundary. Then observe whether it remains below the lower boundary and produces a retest reaction.
- Direction unclear: Price repeatedly crosses near both boundaries without forming a clear structural move away from the pattern.
#Which Behaviors Are Only Potential Breakouts and Cannot Be Confirmed Directly?
A single candlestick moving through a boundary, price quickly crossing and immediately returning to the pattern, and a breakout without continued price action are all only potential breakouts. These behaviors require further observation and should not be treated as confirmed valid wedge breakouts.
Quotable summary: A valid wedge breakout cannot be judged only by whether price briefly moves beyond a trendline. You must also record the breakout direction, breakout location, and subsequent price reaction. When a single candlestick moves through the boundary or price quickly returns to the pattern, the signal should remain classified as a potential breakout.
#What Should You Observe for Retest Confirmation After a Wedge Breakout?
Retest confirmation mainly involves observing whether price returns near the original breakout boundary, whether the boundary produces support or resistance, and whether price subsequently resumes movement in the breakout direction. A retest is not guaranteed; when no retest occurs, do not force a conclusion.
Record the following four items during the retest:
- Approach location: Did price approach the original breakout boundary rather than make an arbitrary brief counter-move?
- Reaction type: Near the boundary, did price rebound, pull back, or move directly back into the pattern?
- Continuation direction: Did price move toward the original breakout direction after the retest?
- Structural state: Can the wedge boundaries still explain current price movement, or have they lost their usefulness?
#What Does Continuation After a Boundary Retest Mean?
Continuation after a boundary retest indicates a subsequent reaction near the original breakout point that is consistent with the breakout direction. It can therefore be recorded as a more complete confirmation path, but it still does not represent a certain trading outcome or return.
Also record whether the retest truly approached the original breakout boundary, whether a clear supportive or restrictive reaction appeared near the boundary, whether price moved away from the boundary again after the retest ended, and whether subsequent price action returned to the wedge.
#How Should You Handle a Retest That Falls Back Into the Pattern?
If price re-enters the wedge after the retest, mark the original breakout as insufficiently confirmed or potentially failed and reassess the upper and lower boundaries. The fact that price previously crossed a boundary does not justify treating the direction as established.
Use the following process:
- Preserve the original breakout location. Do not delete the historical marker; note the direction and time of the first move beyond the boundary.
- Add a status record for “re-entry into the pattern,” noting that it occurred during the retest and recording price’s position relative to both boundaries.
- Check whether the upper and lower boundaries still converge. If they can no longer explain price movement, mark the pattern as failed.
- Wait for price to leave a boundary again, or confirm that the pattern has failed before reviewing it. Do not force a directional choice while the situation remains unclear.
- During the review, compare the boundary-drawing method, chart timeframe, and retest criteria. Record which missing piece of information led to the premature confirmation.
Quotable summary: A retest after a wedge breakout should be evaluated independently by observing the relationship between price and the original breakout boundary. If price resumes movement in the breakout direction after the retest, record it as retest confirmation. If price re-enters the wedge, mark the breakout as insufficiently confirmed or potentially failed.
For an understanding of different trading paths from the perspective of costs and execution, see the MSX Guide to Contract Opening and Closing Paths and Round-Trip Cost Calculations. That content does not change the criteria for evaluating the wedge signal itself. Trading execution and cost information in MSX materials should be verified against the platform’s official pages; this article does not treat platform features or fees as proof that a wedge breakout is valid.
#What Common Errors and Safety Considerations Apply to Wedge Breakout Trading?
The most common issues in wedge breakout trading are premature confirmation, ignoring the retest, and failing to define invalidation conditions. Therefore, breakout, retest, re-entry, and unclear direction should all be included in the same review and risk-management process. This article does not include price, volume, or historical win-rate statistics. The three stages, four steps, and four states described here are analytical frameworks, not market statistics.
#What Problems Can Result From Treating a Single Candlestick Crossing as a Breakout?
Treating a single candlestick crossing a boundary as a valid breakout can cause you to overlook a brief move through the boundary and a rapid reversal. This makes the analysis dependent on a one-time price change. A more cautious approach is to wait for subsequent price action and record whether price remains outside the boundary.
During a review, ask:
- Did the crossing occur near the wedge boundary, rather than result from visual error in drawing the boundary?
- Did price continue to move away from the original structure after crossing?
- Did it quickly return to the wedge?
- Was there a distinct retest stage that could be recorded separately?
#Why Should You Not Ignore Post-Breakout Retest Behavior?
Post-breakout retest behavior provides information that the boundary crossing itself cannot: whether the original boundary has become support or resistance and whether the breakout direction has gained continued follow-through. Ignoring the retest makes it difficult to distinguish a valid breakout from a false breakout.
A retest is not a fixed pattern that must occur. It is an observation framework. When price does not retest, record “retest confirmation not observed.” When price quickly re-enters the pattern, record insufficient confirmation or potential failure.
#How Should You Set Exit-Monitoring Conditions and Control Risk Per Decision?
Write the exit-monitoring conditions before beginning the analysis. They should include pattern failure, re-entry into the pattern, a reversal of the breakout direction, and boundaries that can no longer explain price movement. These conditions are intended to control the decision-making process and do not constitute specific trading advice.
Use the following risk-management checklist:
| State | Review Record | Risk-Management Direction |
|---|---|---|
| Pattern still converging | Upper and lower boundaries remain explainable | Continue observing; do not confirm early |
| Potential breakout | Price briefly moves beyond the boundary | Wait for subsequent reaction |
| Retest confirmation | Price approaches the boundary and then resumes | Record the confirmation path and uncertainty |
| Re-entry | Price returns to the wedge after the breakout | Mark insufficient confirmation or potential failure |
| Direction unclear | Price repeatedly crosses both sides | Pause directional judgment and review the setup |
Technical patterns cannot guarantee results, and leverage or highly volatile markets can amplify losses. Any decision should be made independently based on your risk tolerance, position sizing, and acceptable exit conditions.
#Frequently Asked Questions About Wedge Breakout Confirmation Conditions
Wedge breakout confirmation requires a combined assessment of the boundary crossing, subsequent price action, and retest behavior. No single signal is sufficient to independently prove that the pattern is valid. A review should also preserve the outcomes of pattern failure and unclear direction.
#Is a Wedge Breakout Confirmed Only by Price Breaking the Boundary?
No. Moving beyond the boundary is only an initial indication. You must still observe continuation after the breakout, the reaction after a boundary retest, and whether price re-enters the wedge. A single boundary crossing is insufficient to confirm a valid breakout.
#Does a Retest Always Occur After a Wedge Breakout?
No. A retest is a possible independent confirmation stage, and not every breakout retests the original boundary. When no retest occurs, record that retest confirmation is unavailable rather than assuming that a retest took place.
#How Can You Distinguish a Valid Breakout From a False Breakout?
A valid breakout generally requires price to maintain its direction after leaving the boundary and show a consistent reaction near the boundary during a retest. A brief move through the boundary, a rapid reversal, or re-entry into the pattern indicates insufficient confirmation or a possible false breakout.
#How Should You Review a Failed Wedge Pattern?
First preserve the original boundaries, breakout location, and retest records. Then mark the points at which price re-entered the pattern, the upper and lower boundaries lost their converging relationship, or the direction repeatedly changed. Finally, assess whether the problem involved the boundary-drawing method, timeframe selection, or insufficient confirmation criteria.
#Can You Confirm a Wedge Breakout Without Volume Data?
You can continue observing the structure, but you should not present an assessment made without volume data as a statistical conclusion. Focus on recording the boundaries, breakout direction, post-breakout continuation, and retest reaction, and clearly state that this is a methodological analysis rather than signal validation based on a sample win rate.
#Conclusion
When identifying wedge breakout confirmation conditions in 2026, use the process of “draw the boundaries first, record the breakout next, and observe the retest afterward.” A move through a trendline should only begin the observation process and cannot replace subsequent confirmation. A more complete review records the breakout direction, boundary reaction, re-entry, and pattern failure.
This article is for informational purposes only and does not constitute investment advice. Crypto assets are highly volatile and you may lose your entire principal. Conduct your own research and make independent decisions (DYOR).
FAQ
Is a wedge breakout confirmed only by price breaking the boundary?
No. Moving beyond the boundary is only an initial indication. You must also observe continuation after the breakout, the reaction after a boundary retest, and whether price re-enters the wedge. A single boundary crossing is insufficient to confirm a valid breakout.
Does a retest always occur after a wedge breakout?
No. A retest is a possible independent confirmation stage, and not every breakout retests the original boundary. When no retest occurs, record that retest confirmation is unavailable rather than assuming that a retest took place.
How can you distinguish a valid breakout from a false breakout?
A valid breakout requires observing whether price maintains its direction after leaving the boundary and shows a consistent reaction near the boundary during a retest. A brief move through the boundary, a rapid reversal, or re-entry into the pattern indicates insufficient confirmation or a possible false breakout.
How should you review a failed wedge pattern?
Preserve the original boundaries, breakout location, and retest records. Then mark the points at which price re-entered the pattern, the boundaries lost their converging relationship, or the direction repeatedly changed. Finally, check the boundary-drawing method, chart timeframe, and confirmation criteria for problems.
Related Terms
Want to see the real data for this concept?
After you sign up, you can view live prices, funding rates, and fees for the related assets.
View live prices and fees →